Historical patterns repeat as Bitcoin declines before halving
With the halving event looming roughly 18 days away, Bitcoin is showing a predictable downturn. It has dipped below $65,000, marking a 12% decline from its all-time high and nearly 10% lower since the beginning of April.
In a pattern reminiscent of March, when Bitcoin reached its peak, it promptly retreated to around $60,000, experiencing a 17% decrease.
Historical data reveals drawdowns of comparable or larger magnitude preceding prior halving events.
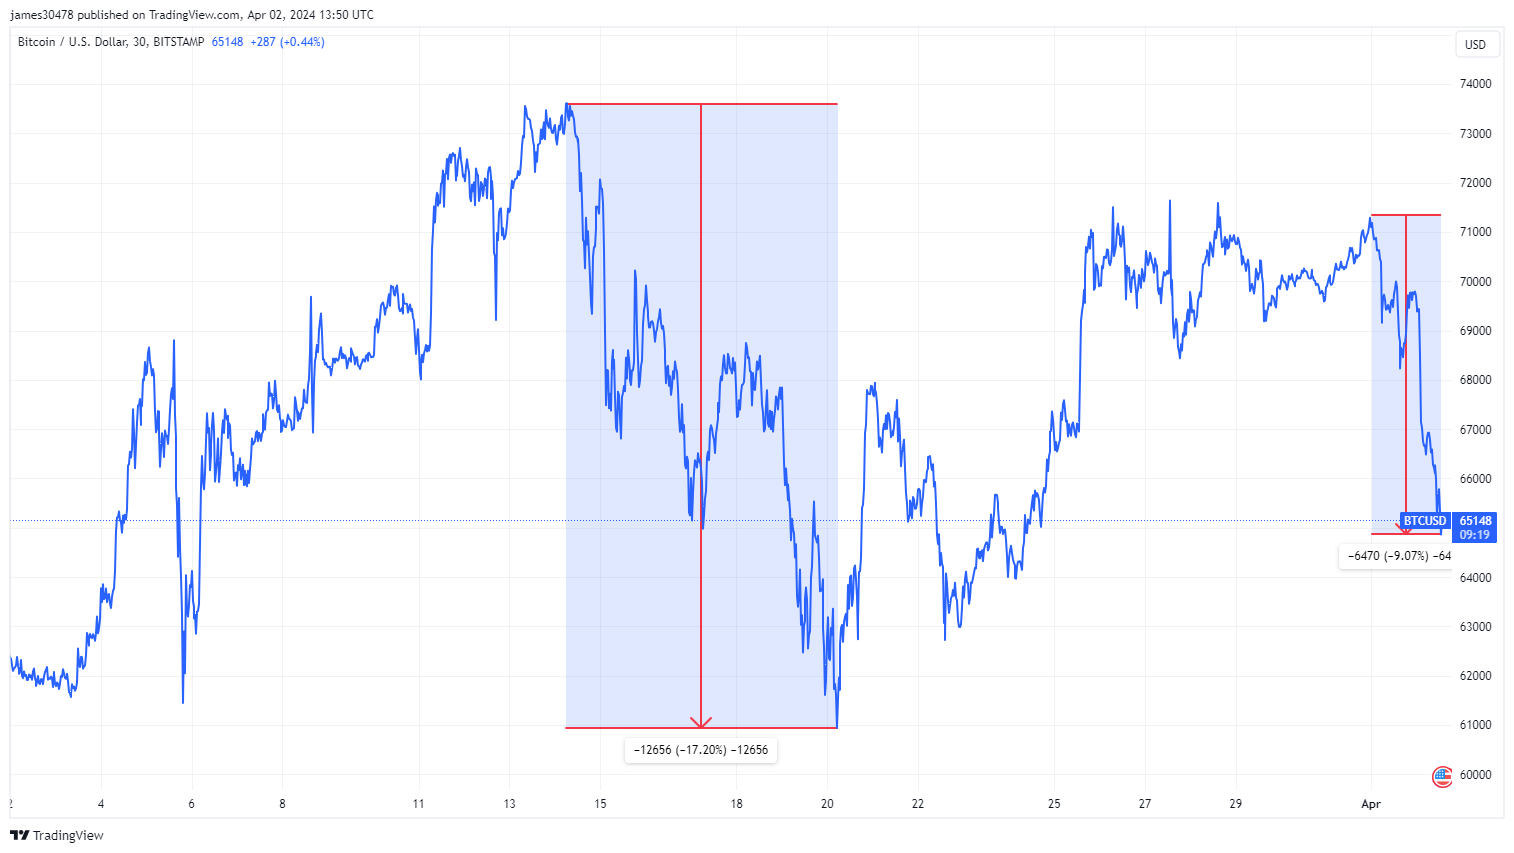 BTCUSD: 2024 Halving: (Source: Trading View)
For instance, before the first halving in November 2012, Bitcoin experienced a 40% decline in August and a 23% drop in October of the same year.
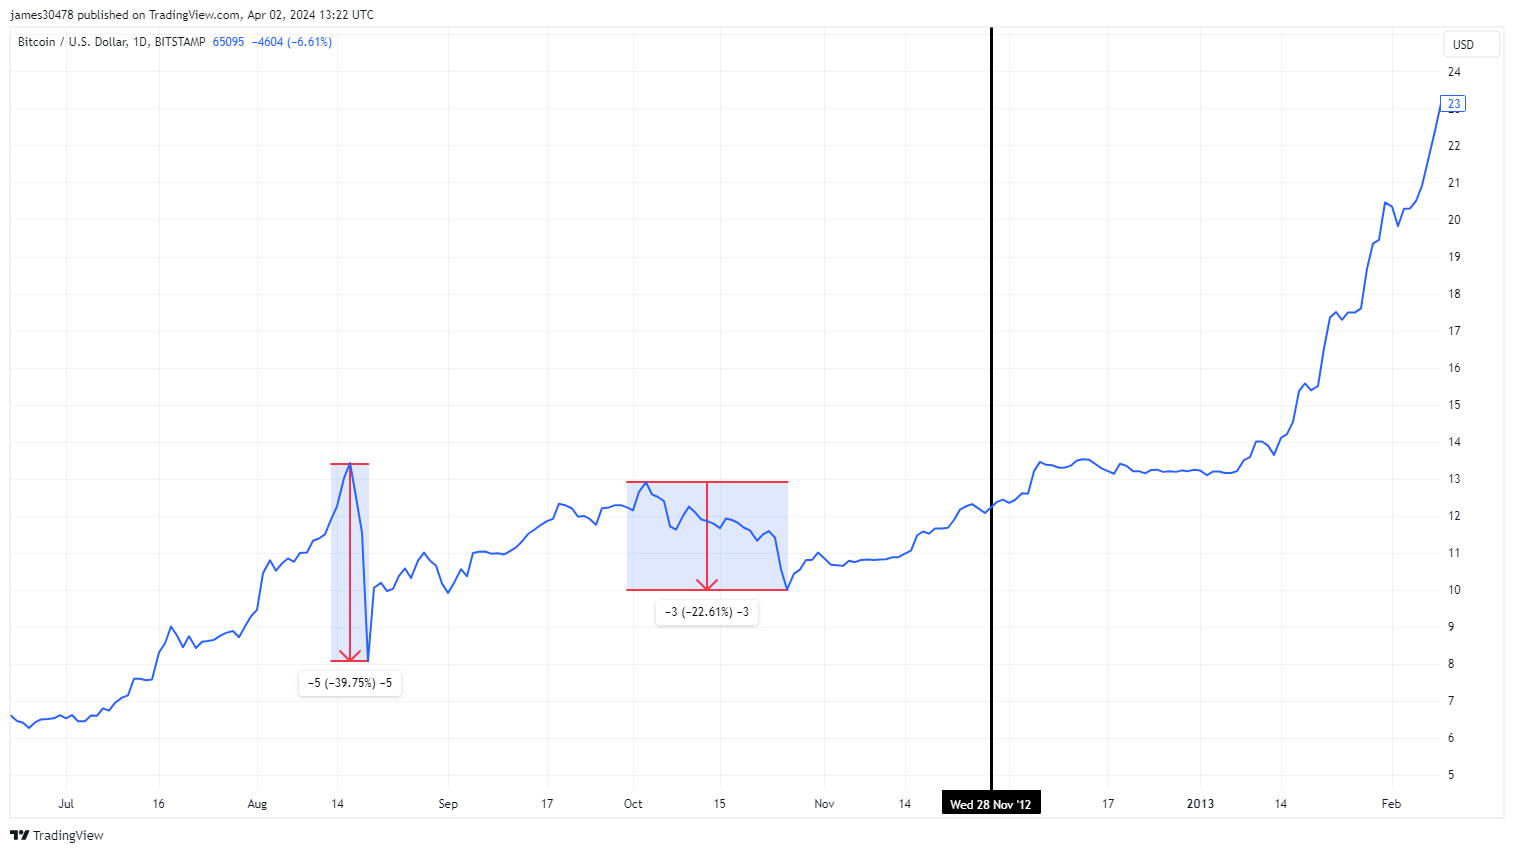 BTCUSD: 2012 Halving: (Source: Trading View)
Leading up to the second halving in July 2016, Bitcoin encountered a 22% decrease in June, followed by an 18% decline in August after the halving.
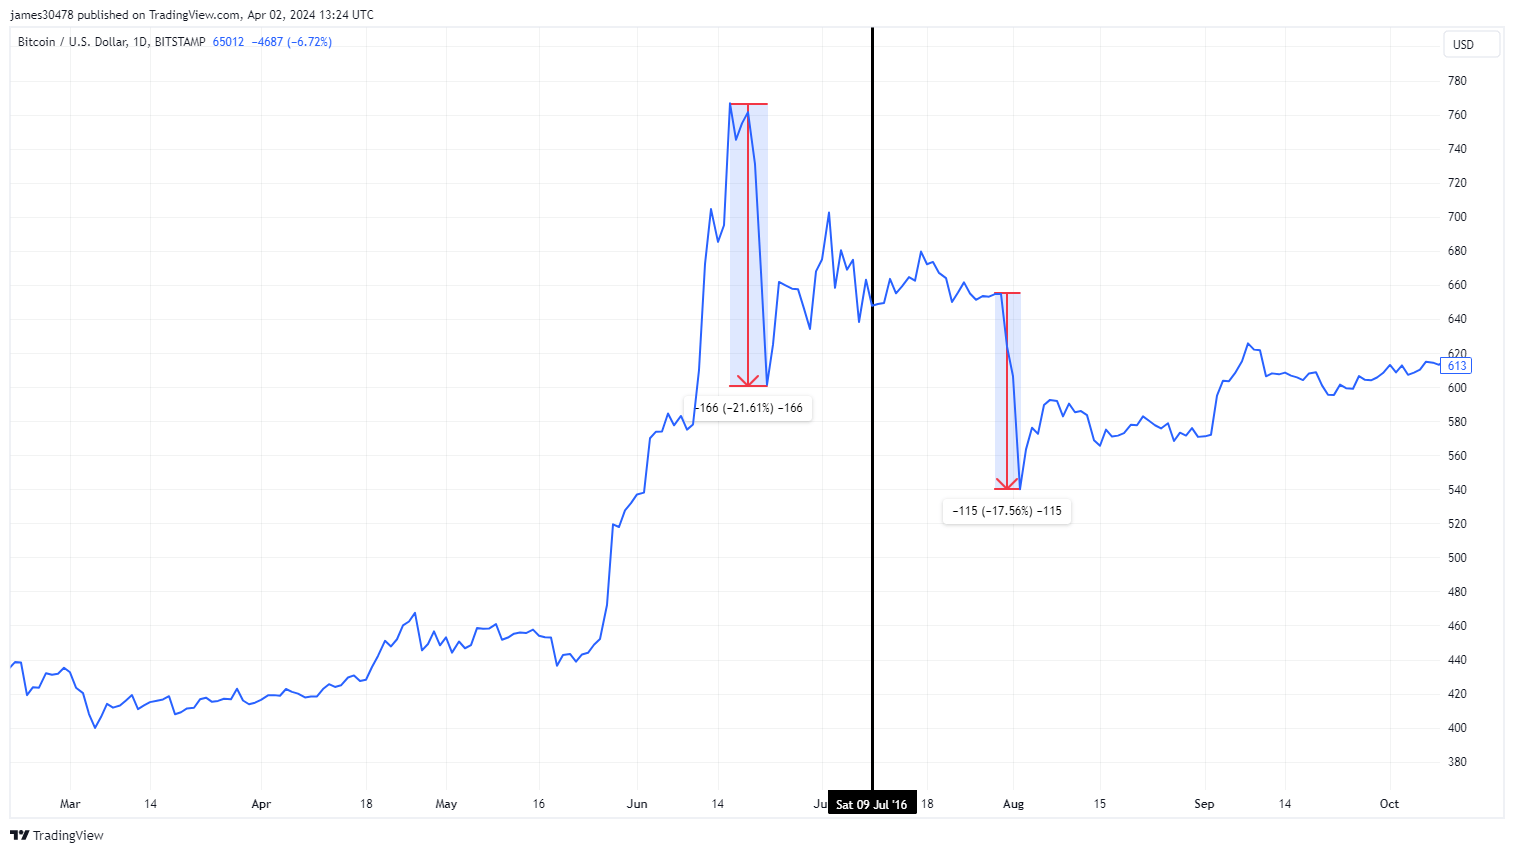 BTCUSD: 2016 Halving: (Source: Trading View)
The 2020 halving in May was followed by an anomalous 53% crash attributed to the impact of COVID-19. However, Bitcoin had fully recovered from the significant crash within the same month.
Meanwhile, Bitcoin experienced a 14% decline just before the halving.
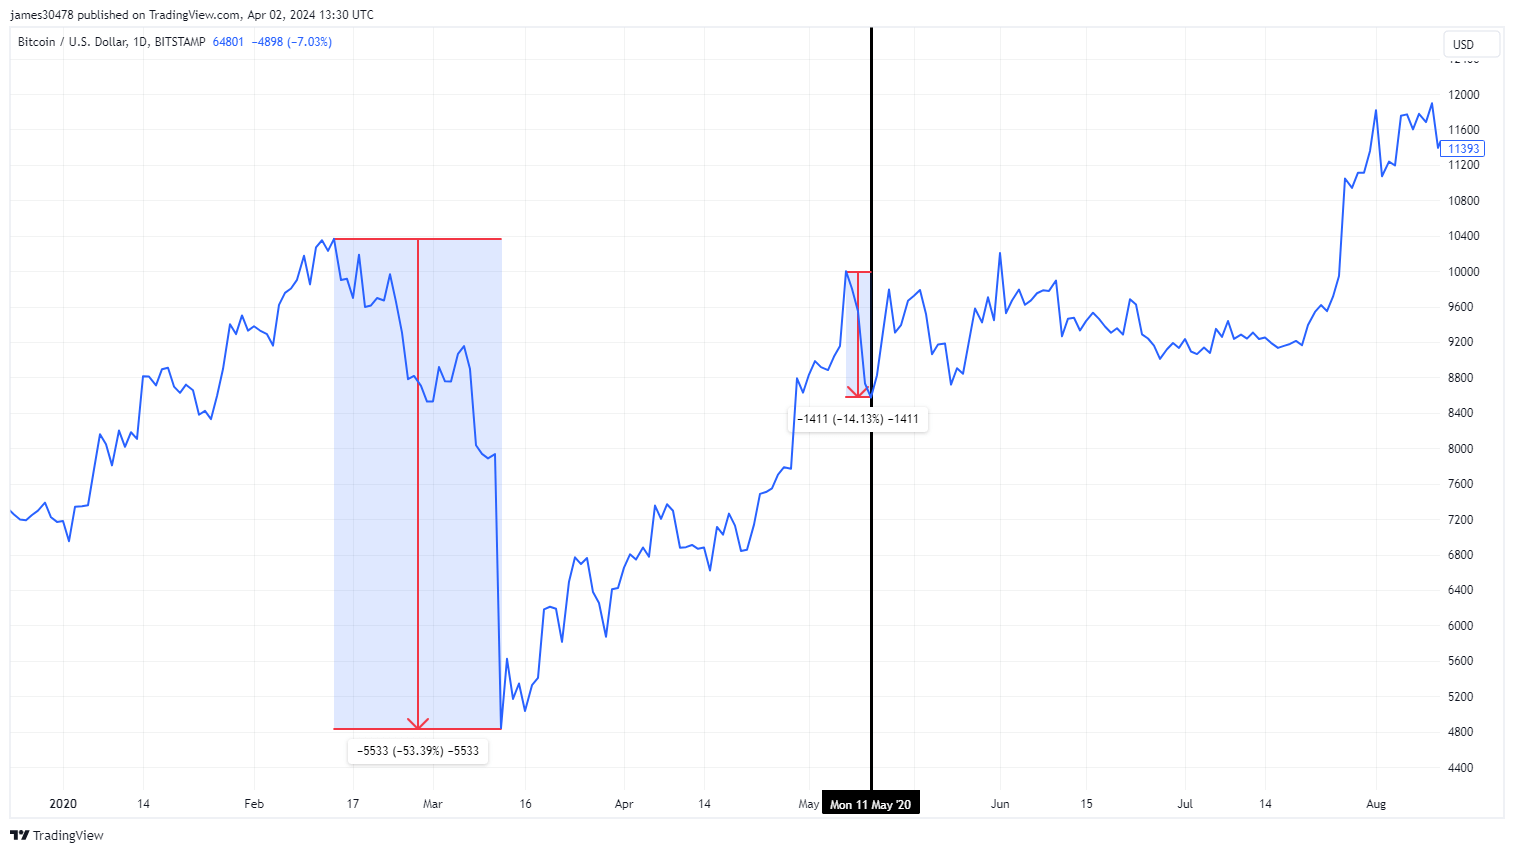 BTCUSD: 2020 Halving: (Source: Trading View)
Though this volatility may concern some investors, it aligns with the characteristic fluctuations observed during halving periods.
The post Historical patterns repeat as Bitcoin declines before halving appeared first on CryptoSlate.