Chainlink (LINK) Price Reaches 2-Year High – When Will it Break $20?
The Chainlink (LINK) price has increased rapidly in the last two weeks, reaching a high of $19.75 today. This is the highest price since January 2022.
LINK also broke out from a horizontal area in place for nearly 90 days. How long will the increase continue?
Chainlink Breaks Out from Horizontal RangeThe weekly time frame technical analysis shows that LINK has increased rapidly since June 2023.
The upward movement stalled at a long-term horizontal area in November. This led to an 85-day consolidation period below resistance until LINK finally broke out last week. Today, the LINK price reached a high of $19.75, the highest in over two years.
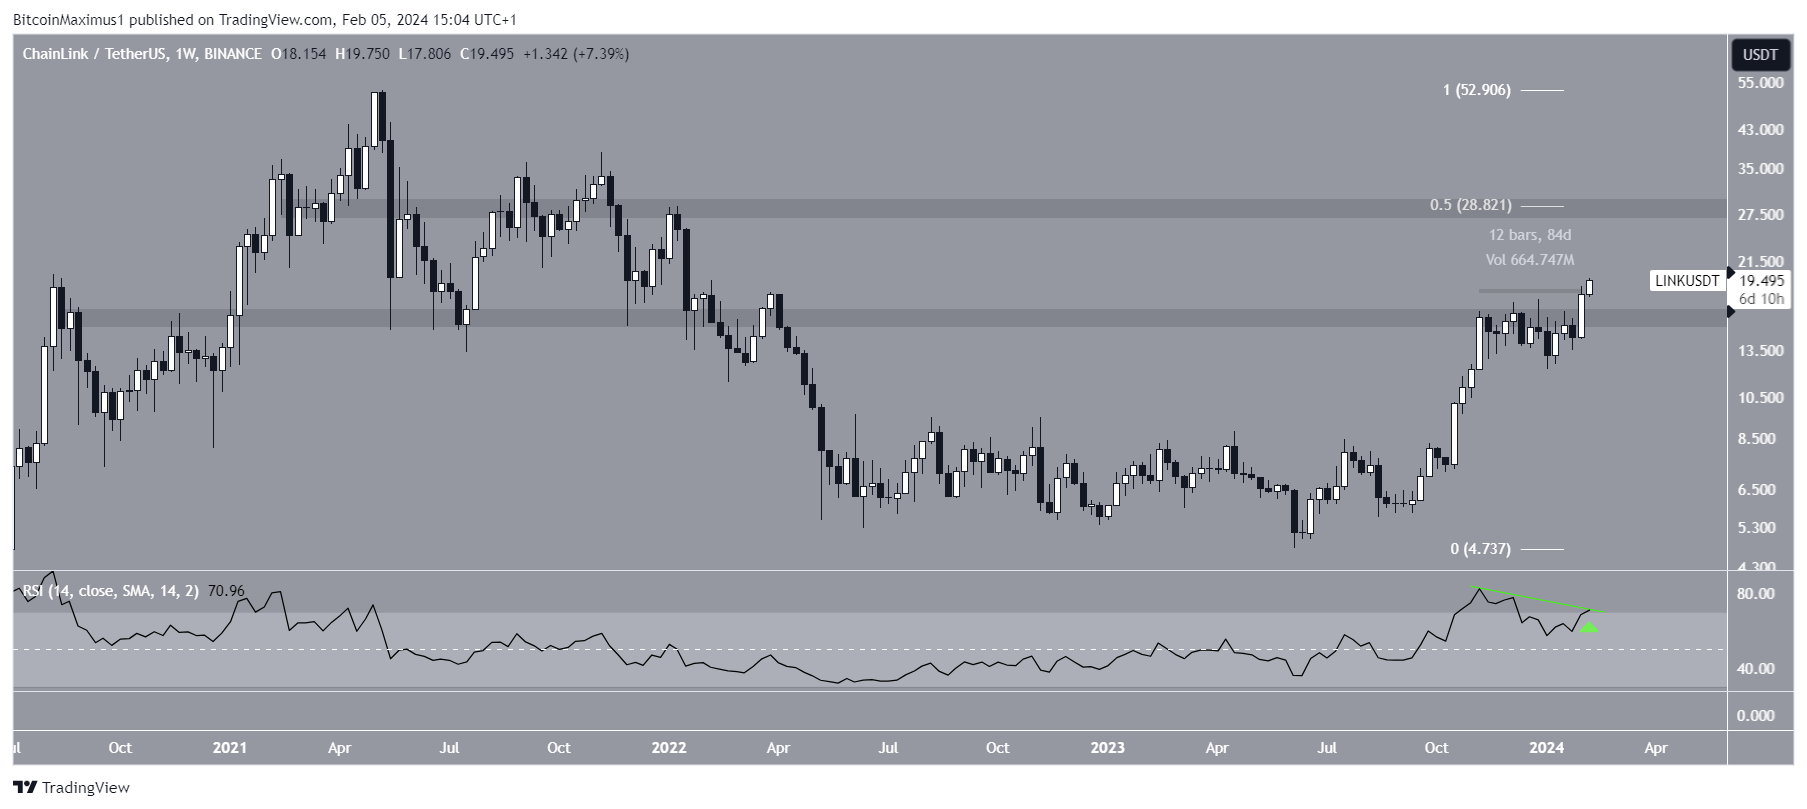 LINK/USDT Weekly Chart. Source: TradingView
The weekly Relative Strength Index (RSI) gives a mixed reading. Traders utilize the RSI as a momentum indicator to assess whether a market is overbought or oversold and whether to accumulate or sell an asset.
If the RSI reading is above 50 and the trend is upward, bulls still have an advantage, but if the reading is below 50, the opposite is true. The RSI is above 50, increasing, and has nearly crossed into overbought territory. However, there is a potential bearish divergence developing in the RSI, something that is associated with bearish trend reversals.
Read More: What is Chainlink (LINK)?
What do Analysts Say?Cryptocurrency traders and analysts on X have an extremely bullish view of the future LINK trend. CryptoMichNL predicts the LINK price will break out from its long-term resistance area.
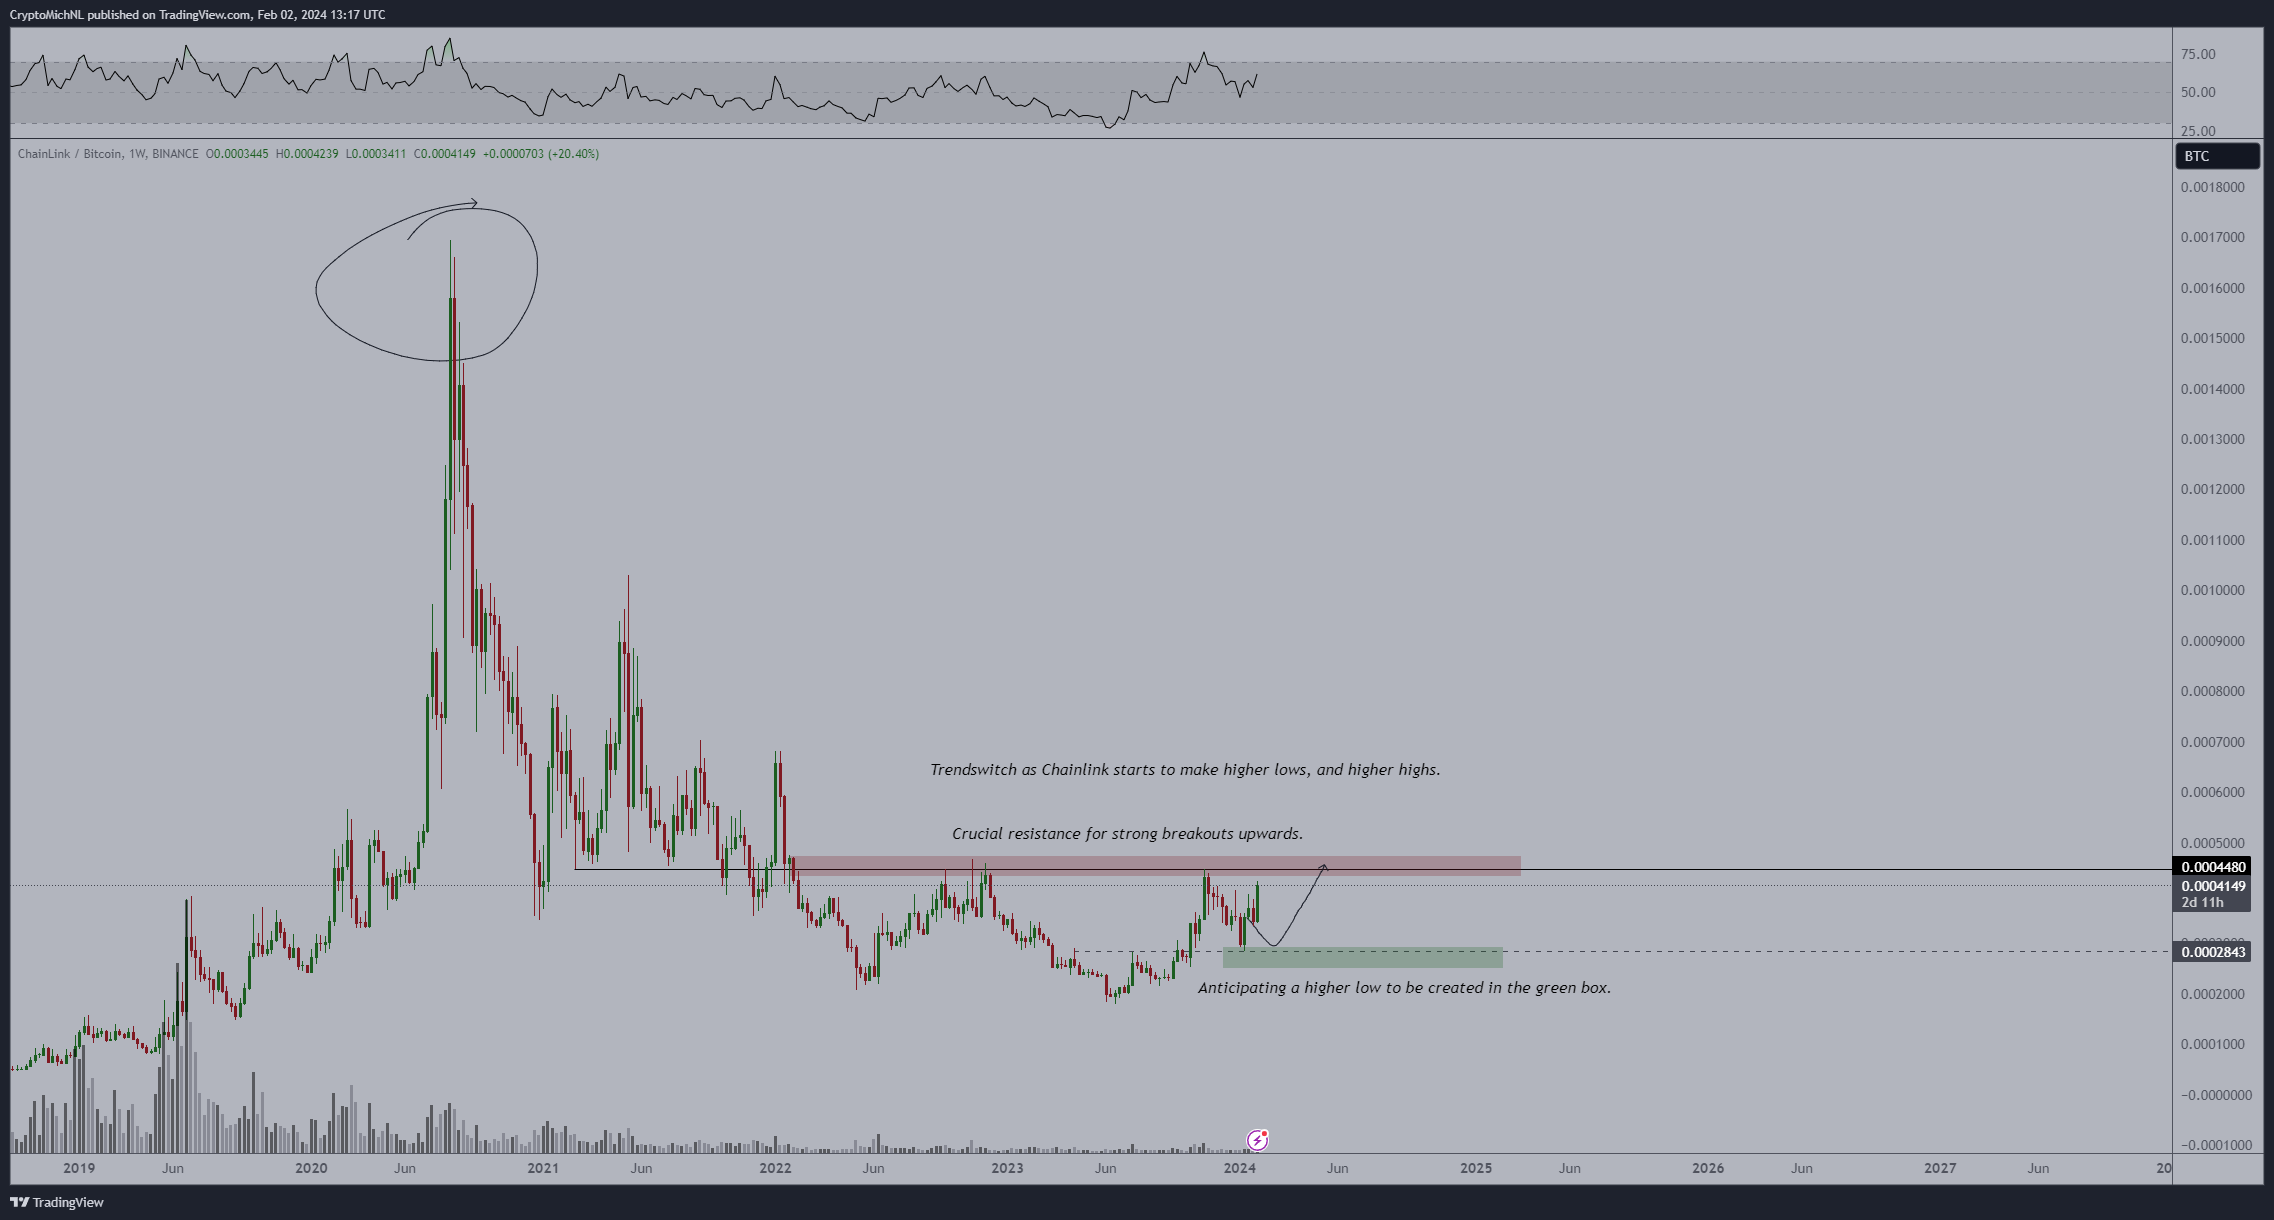 LINK/BTC Weekly Chart. Source: X
ByzGeneral is bullish because of the increase in spot buyers. He tweeted:
$LINK perps basis getting increasingly negative again. Someone’s keeping the spot bid alive. Looks good. I would assume that 20 dolla is resistance for now though.
Due to its bullish close, DavidOnCrypto suggests the LINK price will increase to $20.
Read More: How to Buy Chainlink With a Credit Card
LINK Price Prediction: Is $20 the Next Step?The technical analysis of the daily time frame suggests that the upward movement is expected to continue because of the Elliott Wave count.
Technical analysts employ the Elliott Wave theory as a means to identify recurring long-term price patterns and investor psychology, which helps them determine the direction of a trend.
The most likely count suggests LINK is in the fifth and final wave of its upward movement (black). The sub-wave count is given in white, suggesting that the price is in sub-wave three.
The two most likely targets for the top of the increase are $24.85 and $28.70. They are found by giving wave five 0.382 and 0.5 times the length of waves one and three combined. The latter also coincides with the long-term 0.5 Fib retracement resistance level.
Increases of nearly 30% and 50%, respectively, are needed for the LINK price to reach them.
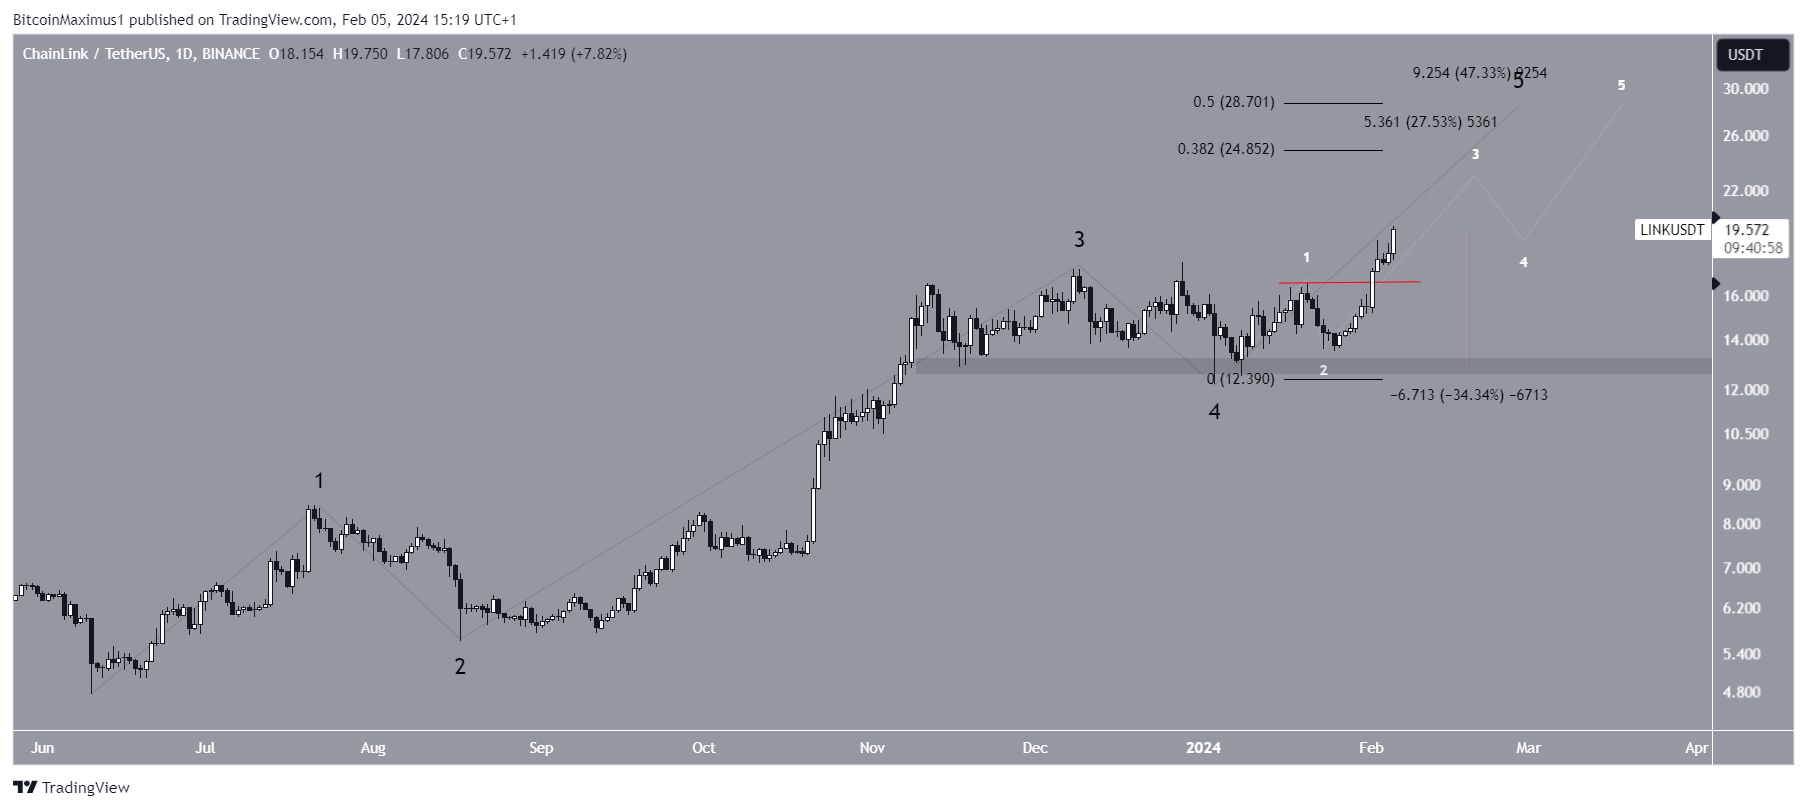 LINK/USDT Daily Chart. Source: TradingView
Despite this bullish LINK price prediction, a decrease below the sub-wave one (red) high of $16.60 will invalidate the count. Then, a 35% drop to the closest support area at $12.80 will be expected.
For BeInCrypto‘s latest crypto market analysis, click here.
Top crypto platforms in the US | February 2024The post Chainlink (LINK) Price Reaches 2-Year High – When Will it Break $20? appeared first on BeInCrypto.