Bitcoin, Ethereum, and XRP: Which Crypto Will Shine the Most in 2026?
Crypto markets are approaching 2026 after a year defined by sharp volatility, fresh all-time highs, profit-taking, and a visible phase of maturation.
Bitcoin strengthened its role as an institutional reserve asset, while Ethereum and XRP entered corrective phases following strong prior trends marked by uncertainty and rapid price swings.
On the macro side, the US Federal Reserve began its first rate cuts, labor market data showed early signs of cooling, and capital flows into digital assets became increasingly selective.
As a result, Bitcoin, Ethereum, and XRP now sit near technically significant levels. The central question for 2026 is whether global liquidity expands or pauses—and whether that liquidity flows decisively into cryptoassets.
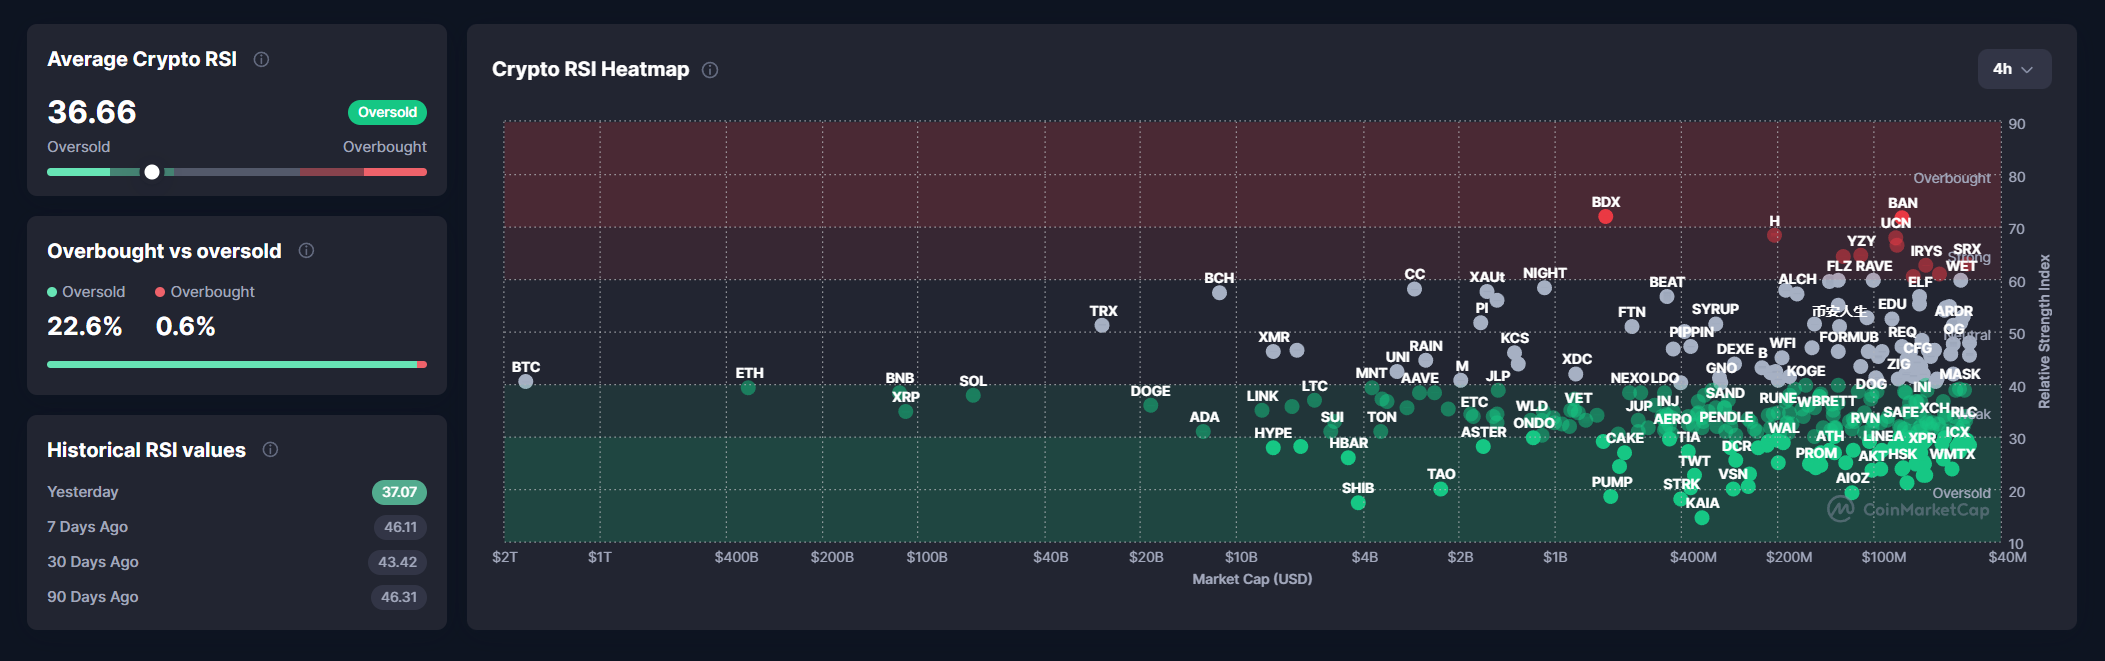 Average Crypto Market Relative Strength Index (RSI) Remains Near Oversold Levels In December. Source: CoinMarketCap
Bitcoin (BTC) Price Analysis and 2026 Outlook
Average Crypto Market Relative Strength Index (RSI) Remains Near Oversold Levels In December. Source: CoinMarketCap
Bitcoin (BTC) Price Analysis and 2026 Outlook
Bitcoin reached a new all-time high above $126,000 in 2025, driven largely by sustained institutional adoption. Corporations and sovereign entities continued to add BTC to their reserves.
MicroStrategy accumulated roughly 660,645 BTC, while El Salvador increased its holdings to 7,502 BTC.
Meanwhile, spot Bitcoin ETFs kept absorbing supply, reinforcing Bitcoin’s role as a long-term macro asset.
From a technical perspective, Bitcoin’s broader bullish structure remains intact despite losing the ascending channel that guided price action from March 2024 to November 2025.
Bank of Japan is about to hike rates with 0.25% on December 19
Bitcoin dumped the last 3 times the BoJ hiked interest rates:
March 2024 → -27%
July 2024 → -30%
January 2025 → -30% pic.twitter.com/GNjHyUIV3d
After setting its latest ATH, BTC corrected into a key demand zone near $80,000.
Resistance around $110,000 continues to cap upside attempts. Trading volume has slowed, a pattern typically associated with corrective phases rather than trend reversals.
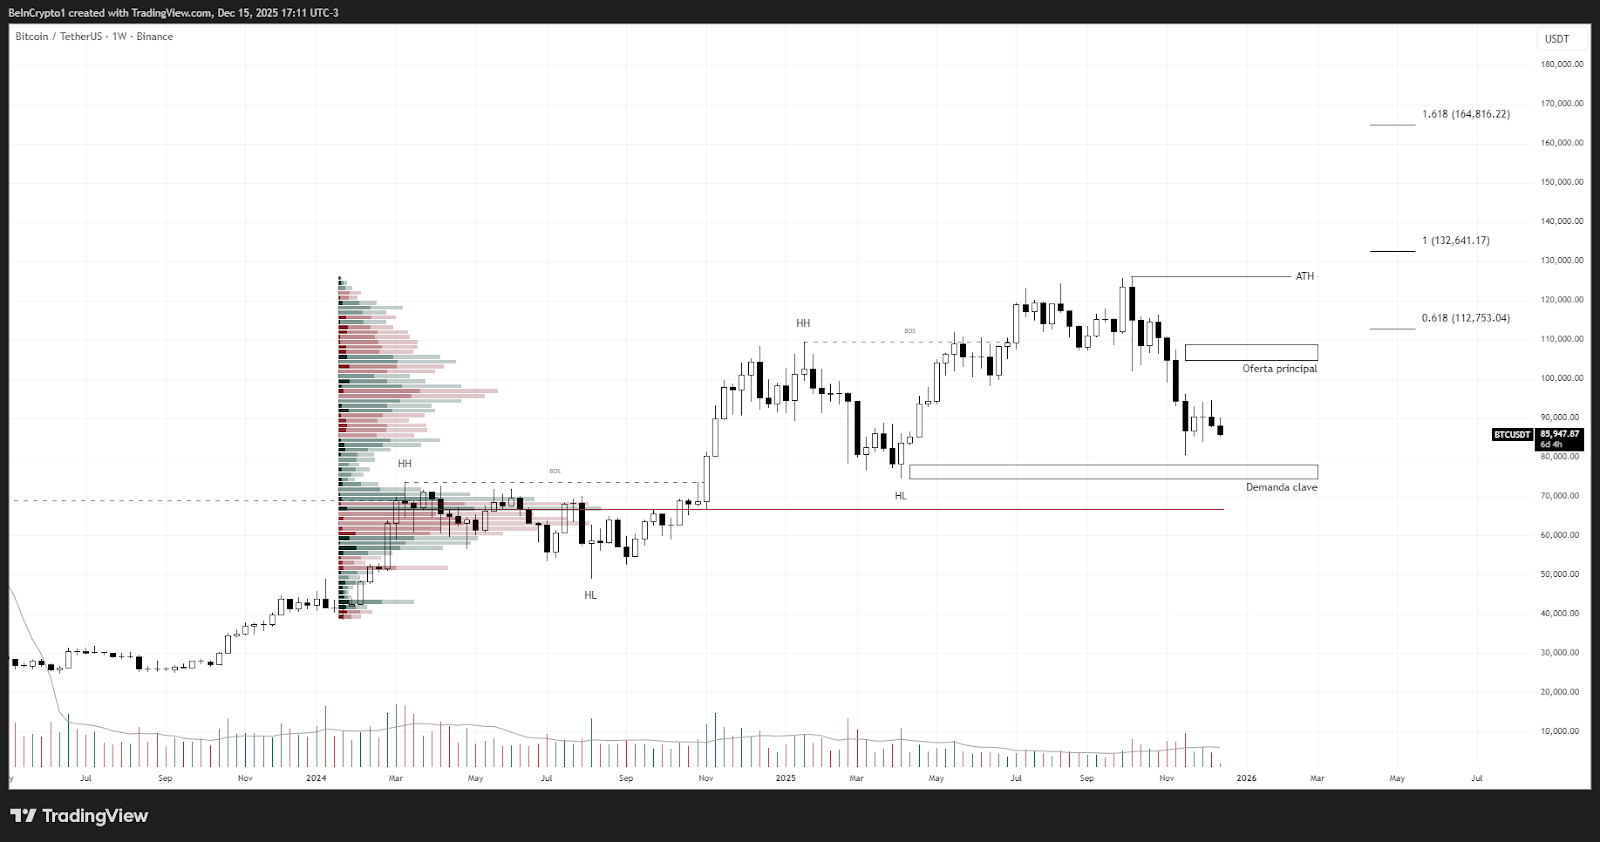 Bitcoin Yearly Price Analysis. Source: TradingView
Bullish Scenario
Bitcoin Yearly Price Analysis. Source: TradingView
Bullish Scenario
A strong reaction from the accumulated demand zone near $75,000 could set the stage for a renewed long-term advance toward $150,000–$170,000.
A sustained breakout above the $100,000–$115,000 resistance cluster would confirm trend continuation, supported by renewed retail and institutional participation.
Range-Bound ScenarioIf upside momentum remains limited, Bitcoin may spend much of 2026 trading between $70,000 and $110,000.
This would represent a prolonged accumulation phase within the broader cycle, marked by choppy price action and false breakouts while the market waits for clearer monetary catalysts.
Bearish ScenarioA decisive loss of the $75,000–$80,000 demand zone would open the door to a deeper correction.
In that case, $60,000–$40,000 could act as a rebalancing zone without invalidating Bitcoin’s long-term macro structure.
Ethereum (ETH) Price Analysis and 2026 OutlookEthereum experienced a pivotal year in 2025, reaching a new all-time high near $4,955.
Network upgrades such as Pectra and Fusaka improved scalability and efficiency, while spot Ethereum ETFs began gaining traction. Staking activity and DeFi usage continued to underpin Ethereum’s fundamental value.
On the weekly chart, ETH remains within a broad long-term ascending channel. After printing new highs in August 2025, price corrected toward a relatively weak demand zone around $2,900.
While the long-term structure remains constructive, momentum has slowed compared to previous expansion phases. Short- and medium-term structures still lean bearish.
Ethereum whales on Binance are bidding the dip hard