Bitcoin, Ethereum, And XRP Price Prediction: Altcoins To Kickstart Bull Rally?
The post Bitcoin, Ethereum, And XRP Price Prediction: Altcoins To Kickstart Bull Rally? appeared first on Coinpedia Fintech News
The crypto market recorded significant volatility during this week amid the pending approval of the ETH ETF by the SEC. Furthermore, top tokens experienced massive price movements this week, indicating an increase in the price action within the crypto space.
Furthermore, the market leader, Bitcoin price, has successfully held its price above the $68K mark, highlighting a rising bullish sentiment in the crypto space. Moreover, the ETH price continues to hover close to its $3,750 level, indicating a high possibility of a bullish price action soon.
With the approval of the Ethereum ETF, will the market leaders, Bitcoin (BTC), Ethereum (ETH), and Ripple (XRP) tokens ignite a fresh bull rally in the crypto market?
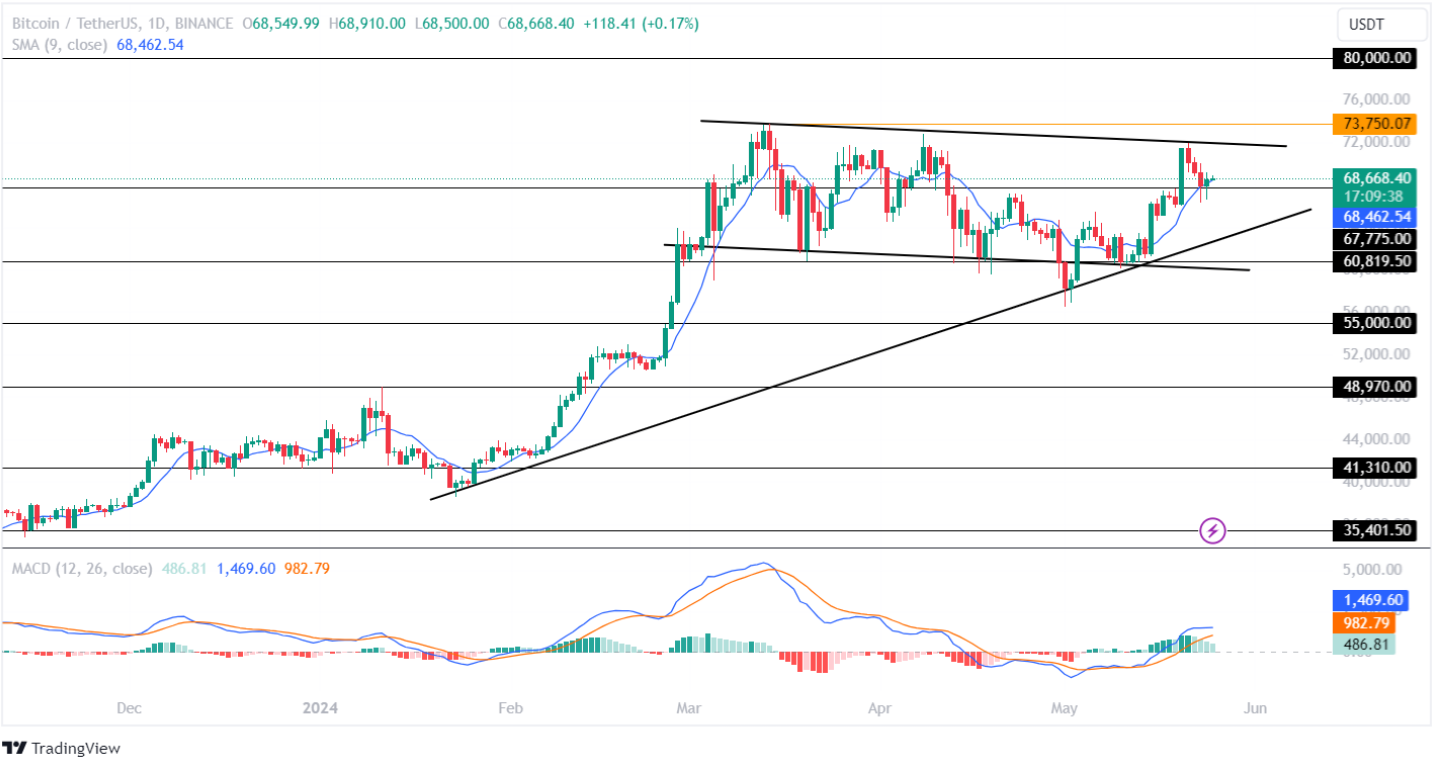
Bitcoin Price Hints At A Positive Price Action:The market leader, BTC price, has displayed a consolidated trend in the 1D time frame, resulting in it forming a channel pattern in the chart. Positively, the support trendline of the symmetric triangle pattern records a constant uptrend, suggesting a long-term bullish sentiment in the crypto space.
 TradingView: BTC/USDT
The technical indicator, SMA supports the price chart in the 1D time frame, suggesting a strong bullish sentiment in the crypto space. However, the MACD displays a constant decline in the histogram with its averages recording a potential bearish curve, suggesting a mixed sentiment.
If the market regains momentum, the Bitcoin price will prepare to retest its resistance trendline over the weekend. Maintaining the price at that level will set the stage for the Bitcoin price to test its previous ATH at $73,750.07 and potentially achieve a new all-time high.
However, an increase in the selling pressure could result in the market leader falling toward its support trendline during the upcoming time.
ETC Price Forms A Bullish Flag Pattern!Following the hype of approval of the spot Ethereum ETF, the ETH price has added approximately 21% this week, highlighting increased bullish influence for the altcoin.
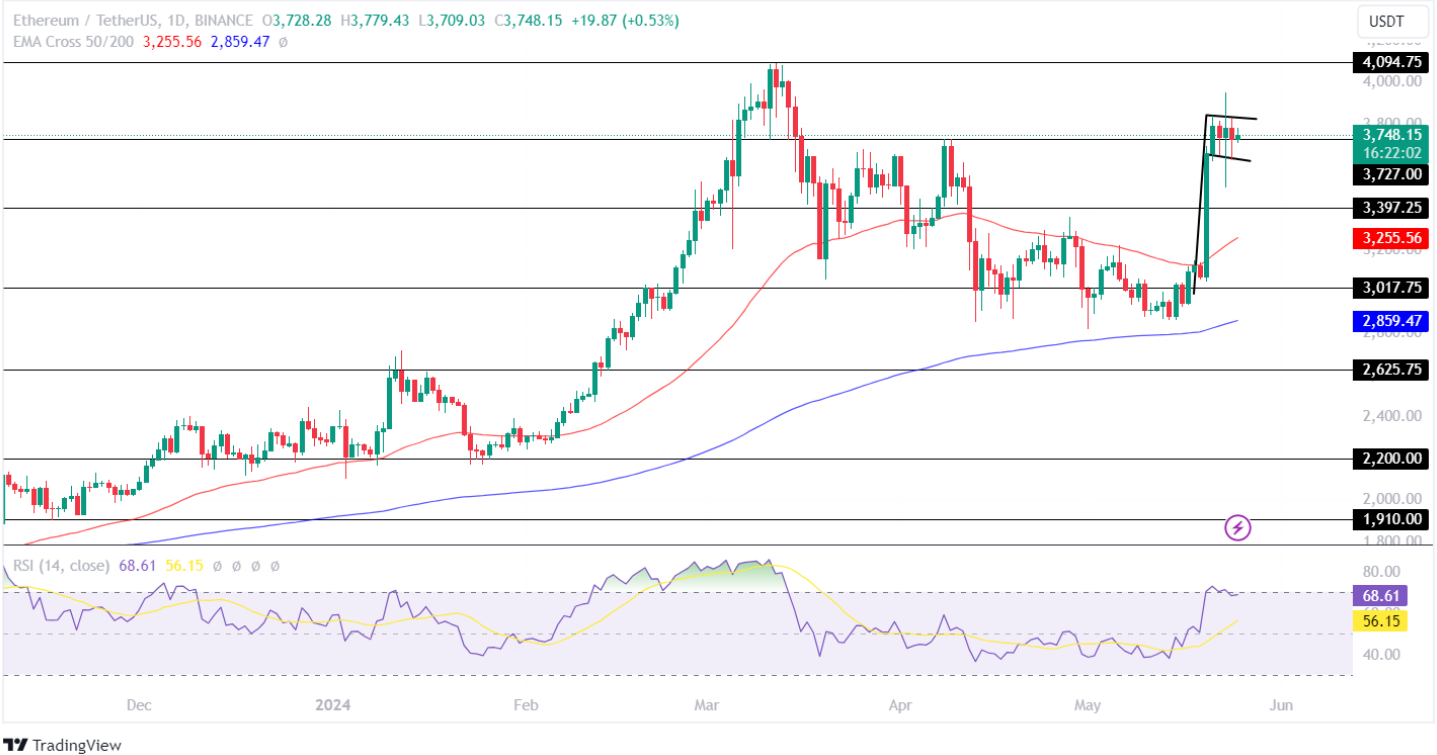
Positively, the altcoin leader, ETH Price, has formed a bullish flag pattern in its price chart, highlighting a rising bullish influence in the crypto market. Furthermore, the Ethereum price constantly holds its price above the support level of $3,727, suggesting a bullish outlook for the altcoin.
 TradingView: ETH/USDT
Furthermore, the Cross EMA 50/200-day shows a bullish curve in the price chart, suggesting an increase in the buying-over-selling pressure for the Ethereum price in the market.
On the other hand, the Relative Strength Index (RSI) continues to hover close to its overbought range with its average displaying a significant uptrend in the chart.
If the bulls break out of the flag pattern, the Ethereum price will prepare to test its upper resistance level of $4,094.75 during the upcoming week. Conversely, bearish price action could pull the ETH token toward its lower support level of $3,400 this month.
Ripple’s XRP Token On The Verge Of A Major Breakout:Despite increased price volatility in the crypto space, the XRP price has displayed a neutral trend by adding approximately 3% within the past day and 1.98% over the past seven days. Moreover, the Ripple token has a YTD return of 13.08%, indicating a mixed sentiment.
 TradingView: XRP/USDT
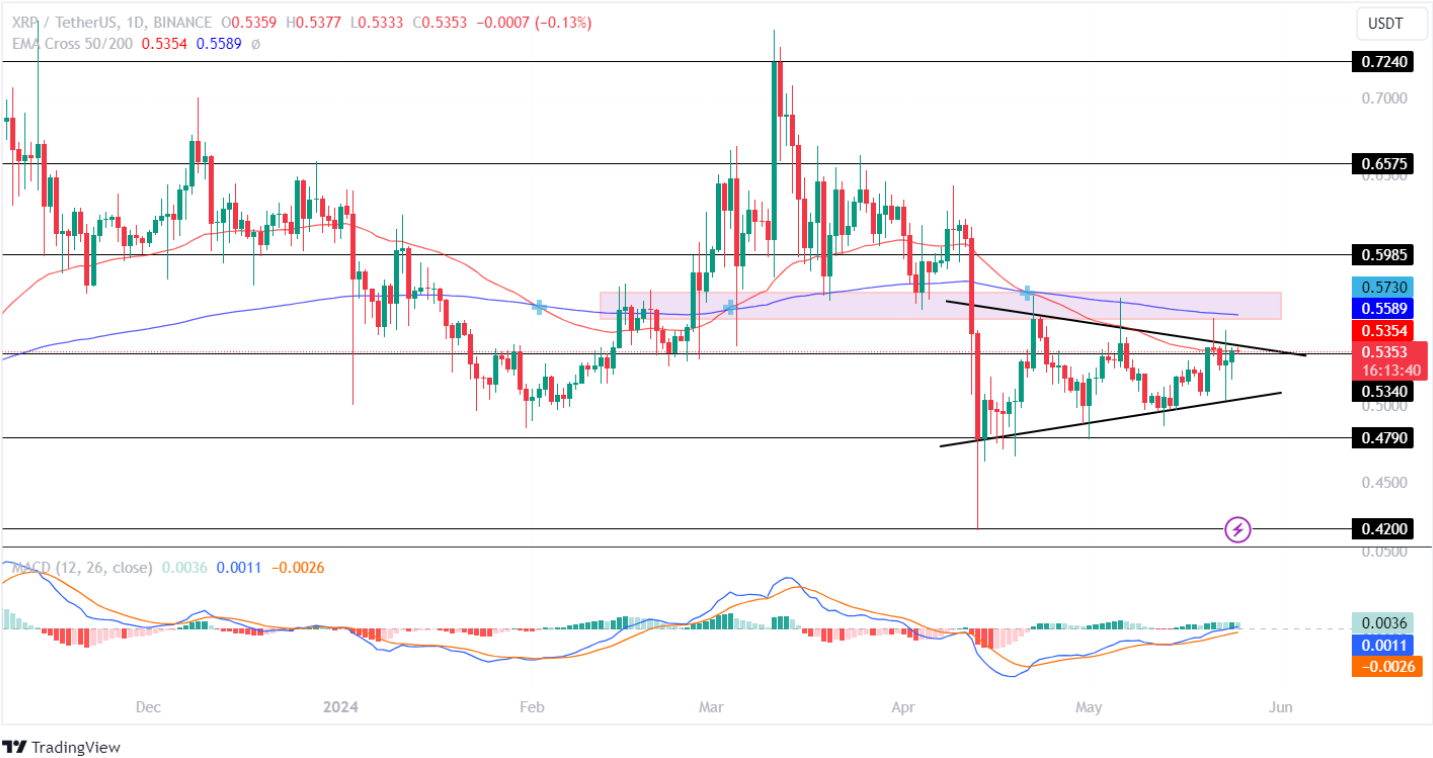
The XRP token has formed a symmetric triangle pattern in the 1D time frame and is hovering close to its resistance trendline. Moreover, the EMA 50-day acts as a resistance to the price chart, highlighting a mixed sentiment in the crypto market.
Furthermore, the Moving Average Convergence Divergence (MACD) has shown a constant green histogram since mid-April, indicating a positive influence on the Ripple price in the crypto space.
If the market breaks out of the resistance trendline, the bulls will prepare to retest its important resistance zone in the coming time. Negatively, a trend reversal could pull the XRP price toward its support trendline this month.
Conclusion:With the approval of the spot Ethereum ETF by the SEC, the cryptocurrency market has entered into a new bull cycle, highlighting a high potential for a fresh rally during the upcoming weeks.
Moreover, top altcoins have displayed a strong bullish pattern in their respective chart, indicating a high possibility of an AltSeason which could result in the crypto market recording a new all-time high (ATH).