Altcoin Rally On The Horizon! CORE, JUP, And FLR Price To See Massive Surge?

The post Altcoin Rally On The Horizon! CORE, JUP, And FLR Price To See Massive Surge? appeared first on Coinpedia Fintech News
Despite the top cryptocurrency tokens struggling to break out of their important resistance levels, the mid-cap altcoins continue to display a significant price action in their respective charts, highlighting a switch of investor’s interest in these tokens.
Altcoins such as Core, Jupiter, and Flare have recorded a positive price action recently, with each adding over 65%, 22%, and 5% to their respective portfolios within the past 24 hours. Will these tokens hold their gains or record a massive correction in valuation during the coming time?
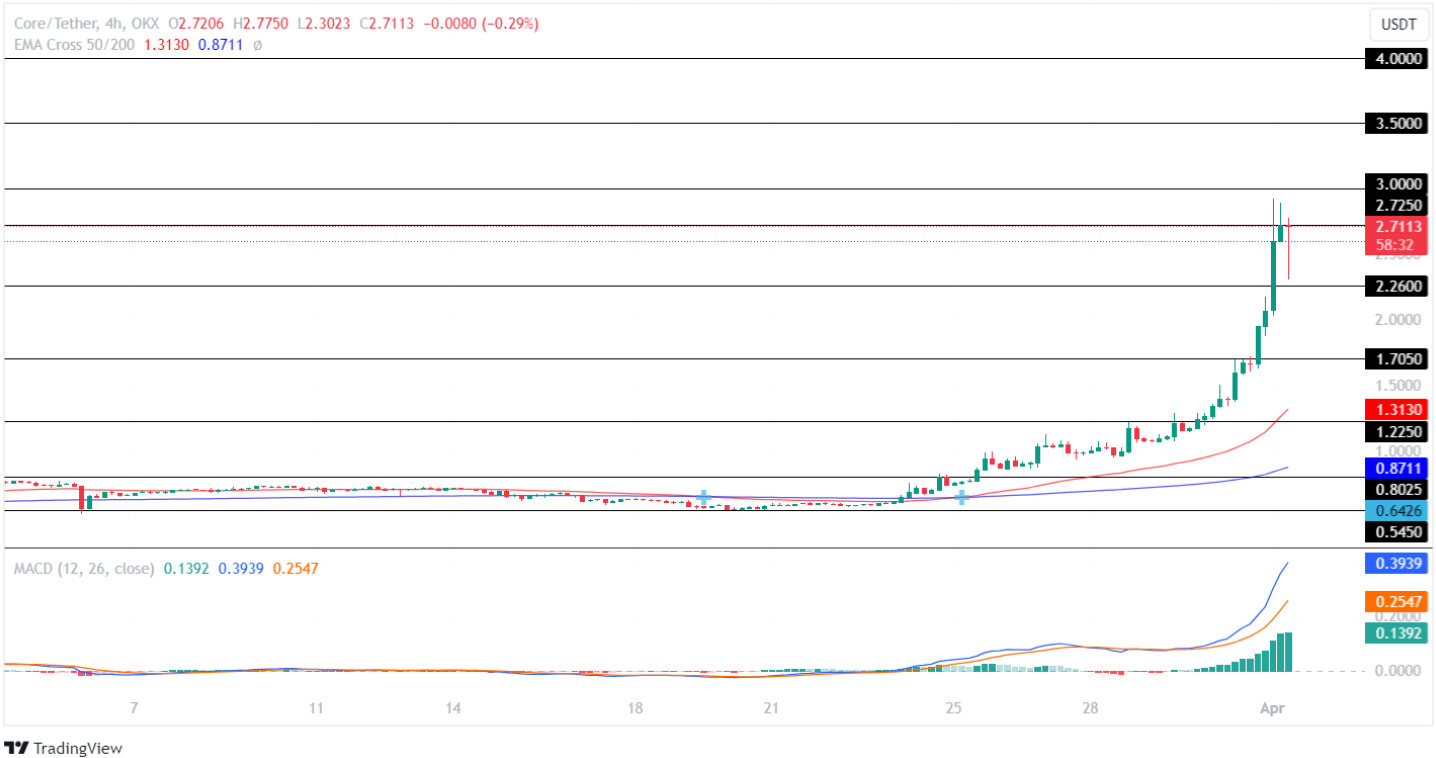
Core (CORE):The Core price traded between $0.5450 and $0.8025 for a brief period, following which the market regained momentum, and the altcoin successfully broke out of the resistance level. After this, the bulls jumped 124% over the next seven days, after which it faced rejection at $1.2250.
After displaying a sideways trend for a while, the bulls regained momentum and recorded a jump of 122.5% before facing rejection at $2.7250 recently. Since then, the price has been hovering close to its support/resistance level and is on the verge of testing it, the outcome of which is unpredictable.
 TradingView: CORE/USDT
The Moving Average Convergence Divergence (MACD) displays a rising green histogram, indicating an increased buying-over-selling pressure in the crypto industry. Moreover, the averages show a significant rise in the chart, suggesting the CORE price will continue gaining value this week.
If the market holds the price above the resistance level of $2.750, the bulls will regain momentum and test its upper resistance level of $4 this month. However, a trend reversal may pull the price toward its low of $1.225 during the upcoming weeks.
Also Check Out : Best Low Cap Altcoins For A Breakout Rally This Week!
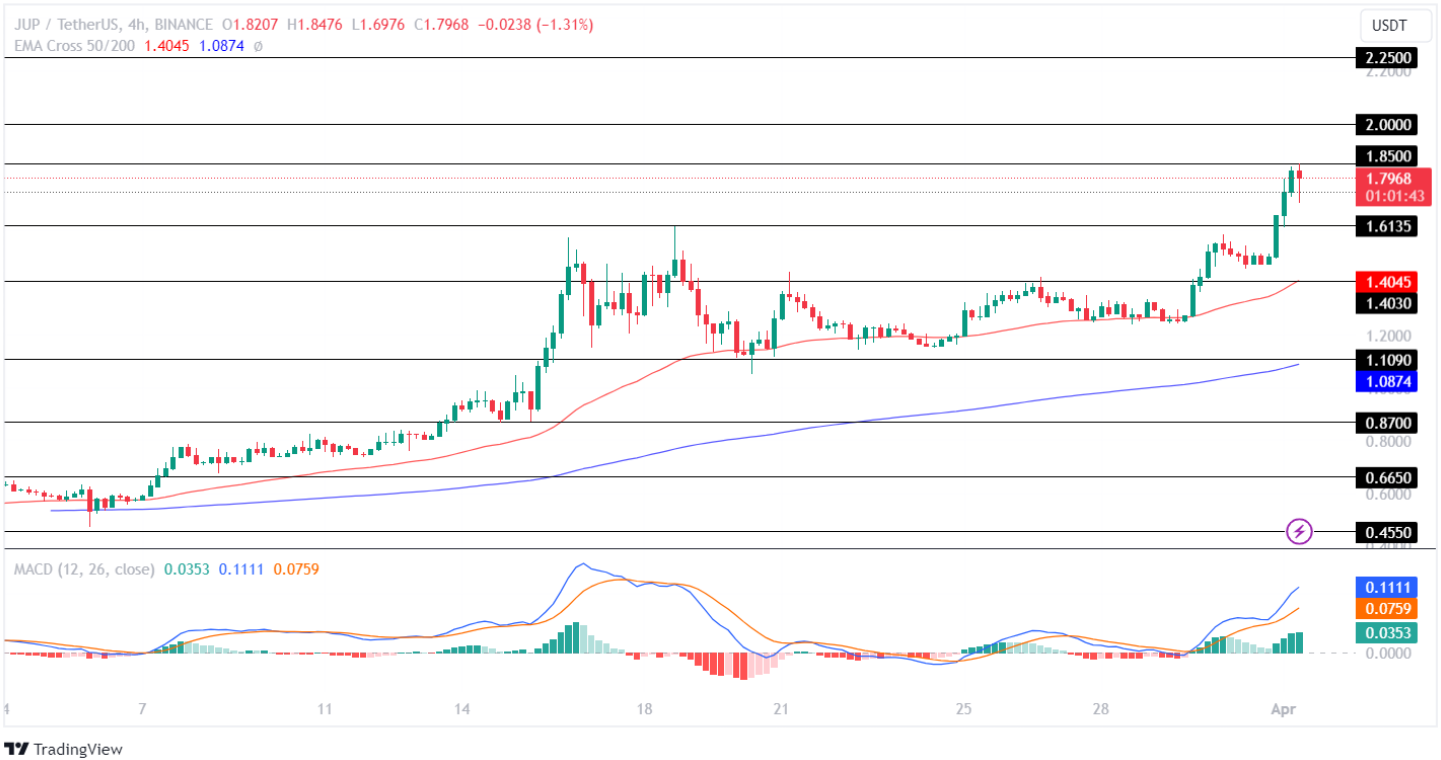
Jupiter (JUP):After displaying a neutral trend for a while, the JUP price broke out of the resistance level where the price traded sideways for about a week. As the market volatility grew, the Jupiter token recorded a jump of over 83% in valuation before facing rejection above the resistance level of $1.4030.
Following this, the Jupiter price traded in a consolidated range between $1.1090 and $1.4030 for two weeks, after which the bulls recently regained momentum and broke out of the upper level. The altcoin is currently on the verge of testing its resistance level, the outcome of which is uncertain.
 TradingView: JUP/USDT
The technical indicator, MACD, shows a constant green histogram, highlighting a strong bullish influence in the crypto space. Further, the averages show a rising pattern, indicating a positive price action for the altcoin this week.
If the bulls surpass the resistance level of $1.850, the JUP price will continue gaining momentum and prepare to test its upper resistance level of $2.250 in the coming time. Conversely, if the bears overpowered the bulls, the price would lose momentum and fall to test its lower support level of $1.4030.
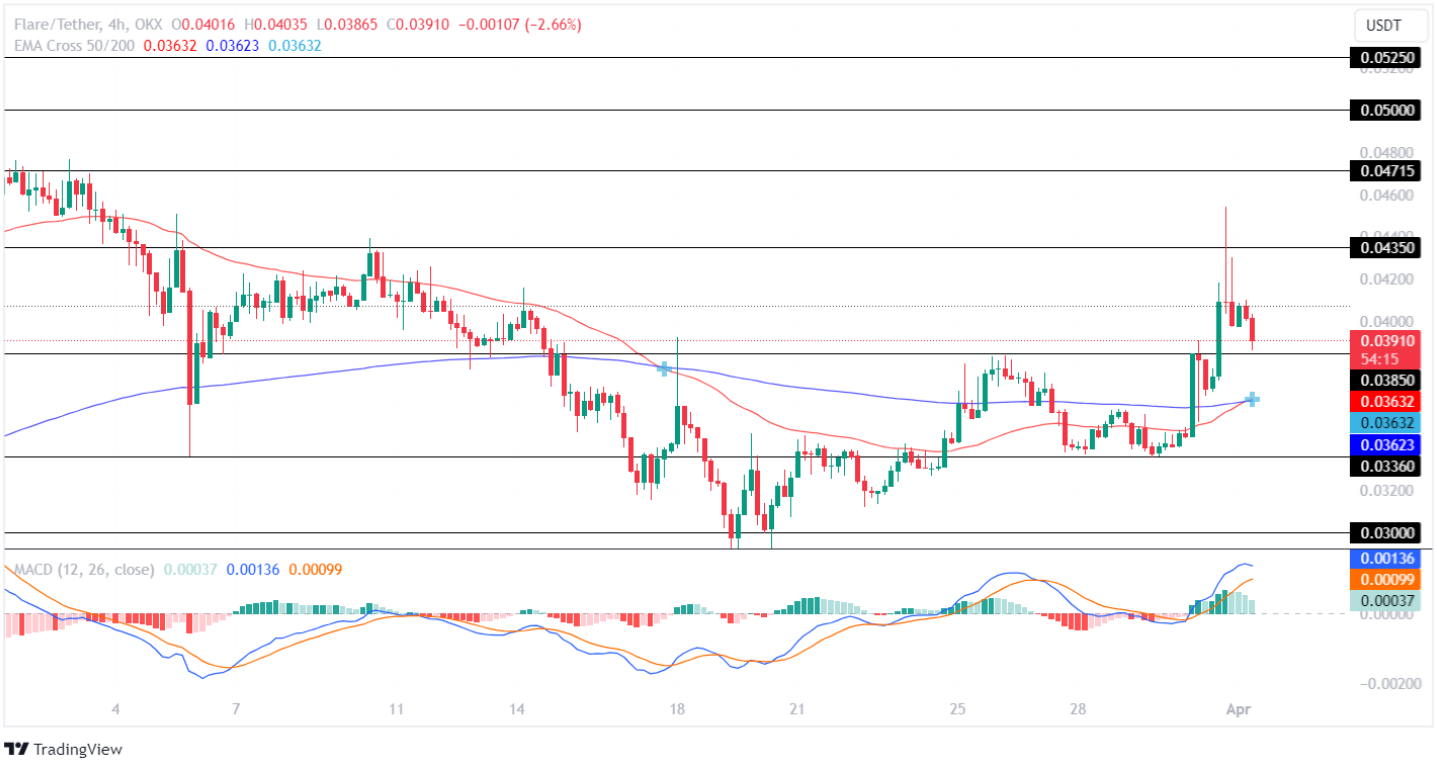
Flare (FLR):The FLR price traded in a closed range between $0.04350 and $0.04715 for a period, following which the bulls lost momentum and started trading under a bearish influence. The Flare token recorded a loss of 23.65%, after which the altcoin displayed a neutral trend for a brief period.
As the market volatility grew, the bulls failed to regain momentum, resulting in the price recording a correction of 26.23%. The bulls held the price above the support level of $0.030, following which the price traded in a closed range for over a week. Recently, the bulls broke out of the resistance level, and since then, the price has been displaying a neutral trend.
 TradingView: FLR/USDT
The MACD displays a constant decline in the green histogram, and the averages show a bearish curve in the chart, suggesting a weak price action. On the other hand, the Cross EMA 50/200-day records a Golden Cross, highlighting a mixed sentiment in the market.
Read More : What’s Next for Bitcoin, Ethereum, and Solana Price?
If the market holds the price above the support of $0.03850, the bulls will regain momentum and run to test its upper level of $0.04715 this month. Negatively, if the bulls fail to regain momentum, the price will prepare to test its lower support level of $0.03360 in the coming time.